

COQUITLAM & TRI-CITY MARKET REPORT
NOVEMBER 2019

Author: Meryl Hamdillah, REALTOR with Sutton WestCoast Group.
If you are looking for a realtor to help you buy or sell a property in Coquitlam or Vancouver, feel free to Chat with me now! 604-307-9506
November in Tri-City continued the trend back to typical levels. There were 338 total home sales in the Tri-Cities which is 42.6% higher than the same time last year but was a decline of -19.9% from October last month.
NOTE: Use the top toolbar to flip through pages for all the Tri-Cities.
Tri-City Market Report: Real Estate Market Report of Coquitlam, Port Coquitlam and Port Moody. Includes market data from Real Estate Board of Greater Vancouver with a breakdown for Detached Homes, Townhomes, Condos & Apartments.
Market Insight for Coquitlam
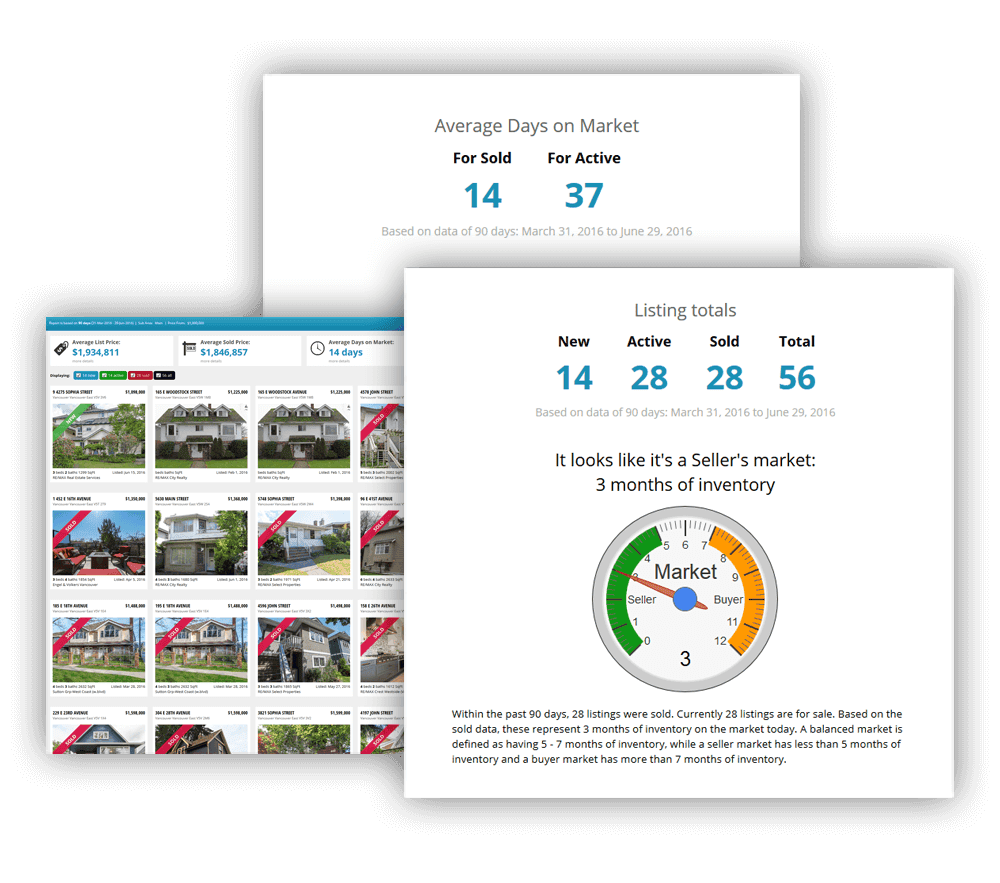
We started to see more home buyer confidence in the summer and this trend continues today. It’ll be important to watch home listing levels over the next few months to see if supply can stay in line with home buyer demand. Inventory in the Tri-Cites dropped further to 1096 homes. The drop is typical this time of year but it will be interesting to see what will happen in January with the increased demand. Last month’s sales in the Tri-Cities was 338 which is close to the 10-year average in November.
Sellers Market
The Tri-City market shows that the sales to active ratios are moving further into a sellers market. The sale-to-active ratio is .403 vs .360 for the November 10 year average. The top neighbourhoods by sales are indicated in the infographics for each city and property type. However, if you are interested in a specific price band or neighbourhood, we can provide you with custom data. Contact us if you would like to have a custom report.
EMAIL us at [email protected] or CALL us at 604-307-9506.